
Have you ever looked at the stock market soaring to all-time highs and wondered, “Are we riding a dangerous speculative bubble, or is this sustainable economic growth?”
During my 5+ years working at ICICI Prudential, retail investors would walk into my office almost daily during major market rallies asking if they should stop their Systematic Investment Plans (SIPs) or cash out their mutual funds. Back then, as a Computer Engineer with an MBA navigating financial markets, I realized that relying on financial news noise or emotional intuition is the fastest route to wealth destruction.
In my 14+ years of actively investing in mutual funds and over a decade in Indian stock markets, one macroeconomic benchmark has consistently helped me step back and judge market valuation levels objectively: The Buffett Indicator.
In this comprehensive guide, we will break down what the Buffett Indicator measures, why it carries Warren Buffett’s name, where Indian and global stock markets stand today, its core limitations, and how you can use this metric to manage your portfolio with confidence.
What the Buffett Indicator Measures
The Buffett Indicator—frequently referred to by market analysts as the Buffett Index or Buffett Ratio—is an aggregate valuation tool that measures the total market value of a country’s listed stock market relative to the overall size of its economy, represented by Gross Domestic Product (GDP).
In plain English, it is a simple way to check whether the stock market has grown significantly faster than the underlying economy driving it.
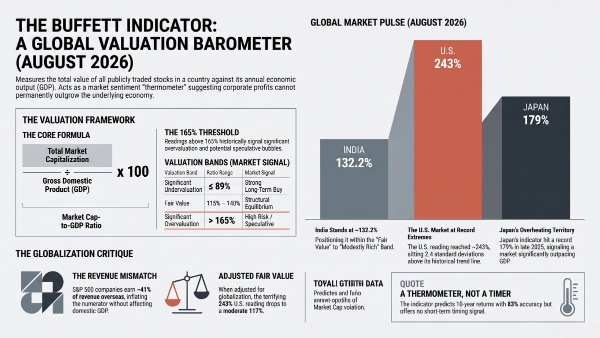
To understand how the Buffett Indicator works in practice, let’s look at its two fundamental components:
- Numerator (Total Market Capitalization): This is the combined market capitalization of all publicly traded companies listed on a country’s stock exchanges. In the Indian equity market, this is measured using the aggregate market value of all companies listed on the Bombay Stock Exchange (BSE) or National Stock Exchange (NSE).
- Denominator (Nominal GDP): This is the total monetary value of all finished goods and services produced within the country over a 12-month period. We use nominal GDP because market capitalization is quoted in current, nominal values unadjusted for inflation.
The core idea is intuitive: stock prices represent investor expectations of future corporate profits. Because corporate profits are tied to broader economic output, the aggregate market value of listed companies should broadly align with GDP growth over long market cycles.
Why It Carries Warren Buffett’s Name
While market-cap-to-GDP ratios existed in economic academic literature, this specific metric became famous globally because of Warren Buffett.
In a famous 2001 essay published in Fortune magazine, the legendary investor called the market-cap-to-GDP ratio “probably the best single measure of where valuations stand at any given moment.”
Buffett highlighted that before the dot-com bubble crash in 2000, the US Buffett Ratio shot up to an unprecedented high of nearly 140%. He pointed out that when total stock market valuation drastically outpaces economic output, future stock market returns are bound to be muted or followed by sharp market corrections.
Since then, institutional fund managers, asset allocators, and financial advisors worldwide have tracked the Buffett Indicator as a broad thermometer for market valuation health.
The Three Broad Valuation Zones
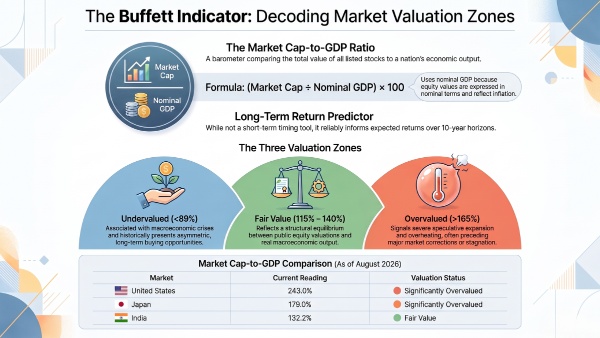
To evaluate the reading of the Buffett Indicator, market strategists analyze historical data across decades of market cycles to categorize readings into standard valuation bands.
Historically, these zones help investors judge whether overall equity markets are cheap, fairly valued, or overheated:
Valuation Band | Ratio Range | Market Valuation Signal & Implications |
| Undervalued | $\le 89\%$ | Associated with deep macroeconomic crises or market panic; historically offers compelling long-term accumulation opportunities. |
| Fair Value | $115\% < \text{Ratio} \le 140\%$ | Reflects structural balance between listed equity valuations and national economic output. |
| Overvalued | $> 165\%$ | Signals excessive speculative expansion and overheating; historically precedes market corrections or prolonged flat returns. |
When I design asset allocation frameworks at PaisaForever, these broad zones serve as a macro compass. When the Buffett Ratio drops into undervalued territory (such as during the March 2020 pandemic sell-off), it signals an extraordinary risk-reward entry window for equity mutual funds. Conversely, when the indicator enters overvalued bands, it calls for portfolio rebalancing and risk management.
Where India Stands Today
As of mid-2026, India’s Buffett Indicator reading is sitting in a range of “fair value to modestly stretched.”
Macroeconomic tracking data compiling aggregate BSE market capitalization relative to India’s nominal GDP places the country’s current Buffett Ratio at approximately 123.85%.
While this reading is higher than the sub-100% levels recorded during past market bottoms, it remains well below extreme speculative levels. Compared to several major global stock markets, India’s Buffett Index reflects a market that is moderately priced relative to its long-term growth expectations rather than a market in a speculative bubble.
Where the US Stands Today
While India’s reading remains moderate, the stock market valuation in the United States presents a dramatically different picture.
The US Buffett Indicator is currently hovering at an all-time high, calculated at approximately 218% to 220%+.
To place this in historical context:
- During the 2000 Dot-Com Bubble Peak, the US ratio reached approximately 140%.
- Before the 2008 Global Financial Crisis, the US ratio stood near 110%.
- Today’s US reading of ~219% is roughly 64% above its historical trendline, indicating significant structural overvaluation.
This historic expansion in US stock market value has been driven by mega-cap technology and AI-focused stocks, whose market caps have grown far faster than baseline US nominal GDP.
What is Driving India’s Market Cap Growth?
In my 10+ years of tracking Indian equity markets, India’s market-cap-to-GDP ratio has expanded from around 55% in the early 2000s to over 120% today. This expansion in India’s Buffett Indicator isn’t merely a result of price inflation; it is backed by structural shifts across the Indian economy:
- Explosive Retail Participation & SIP Culture: AMFI data confirms that domestic Systematic Investment Plan (SIP) inflows consistently exceed ₹20,000 crore every month. This creates a steady domestic liquidity engine that absorbs foreign fund outflows.
- Accelerated Economy Formalization: Business activity in India is rapidly shifting from unorganized sectors to organized, listed companies. As listed firms capture larger market share, total market capitalization naturally grows faster than baseline GDP.
- Primary Market Expansion (IPOs): Heavy IPO activity—including tech startups and public sector listings on the NSE and BSE—adds new corporate market value directly to the total market cap without immediately raising current GDP numbers.
- Dominance of High-Margin Sectors: High-margin sectors like Banking, Financial Services, and Information Technology command large index weightages, boosting corporate profitability relative to underlying GDP.
The Key Limitation of the Indicator
Despite its popularity among analysts, the Buffett Indicator has one major structural limitation: globalization and overseas corporate revenues.
When Warren Buffett popularized this metric, companies primarily earned their revenues within their home countries. Today, major listed multinational corporations generate a vast portion of their profits overseas.
For example, Indian IT majors (such as TCS and Infosys) and pharmaceutical leaders earn a massive share of their revenues from North America and Europe. However:
- Their entire market capitalization is included in India’s total market cap (the numerator).
- Their overseas revenue is excluded from India’s domestic GDP (the denominator).
This revenue mismatch artificially inflates the Buffett Ratio, making modern markets appear more expensive relative to historical GDP benchmarks than they actually are.
Historical Pattern: Extreme Readings and Market Corrections
Historically, extreme spikes in the Buffett Ratio have coincided with notable market corrections:
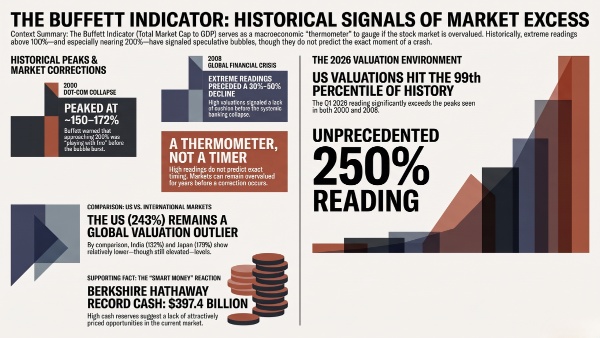
- 2000 Dot-Com Crash: The US indicator peaked before tech stocks experienced a multi-year crash.
- 2008 Global Financial Crisis: Elevated ratio readings globally preceded the subprime financial panic.
- 2020 Covid Bottom: In March 2020, India’s ratio dropped to near 58%, creating a generational buying window for mutual fund investors.
However, a high Buffett Indicator reading alone cannot predict the exact timing of a market downturn. Markets can stay in “overvalued” territory for months or years while corporate earnings continue to grow. Cashing out entirely simply because a ratio looks high often leads to missing out on significant wealth creation.
What the Indicator Does NOT Tell You
To make smart financial planning decisions, you must understand what this macro ratio fails to capture:
- Short-Term Market Direction: It offers zero predictive power for short-term price movements.
- Impact of Interest Rates: Lower interest rate environments justify higher market valuation multiples.
- Corporate Earnings Growth: The ratio compares forward-looking stock prices with lagging GDP data. If corporate earnings grow faster than GDP, higher market valuations can be justified.
- Company-Specific Fundamentals: It is a broad macroeconomic metric that provides no detail on individual stock prices or mutual fund quality.
Global Linkage: How World Markets Impact India
Even though India’s Buffett Indicator (~123%) appears far more grounded than the overstretched US reading (~219%), Indian investors must remember that financial markets are globally connected.
When major global markets experience valuation pullbacks, the spillover impacts Indian equities:
- FII Rebalancing: Foreign Institutional Investors (FIIs) manage capital globally. Valuation shocks in foreign markets often lead FIIs to sell Indian equities to raise liquidity.
- Global Sentiment Spillovers: Market panics in developed economies temporarily depress market multiples across emerging markets, creating short-term volatility on the Sensex and Nifty 50.
How to Position Your Portfolio Today
When the Buffett Indicator shows that markets are in a “fair value to modestly stretched” posture, here is the clear strategy I follow for my own equity investments:
- Rebalance Asset Allocation: If your target asset allocation is 70% Equity and 30% Debt, check your portfolio. If stock market gains have pushed your equity holding to 80%, rebalance back to your target level to secure gains.
- Continue Monthly SIPs: Never stop active SIPs in quality mutual funds based on macro ratio headlines. Rupee cost averaging works best when you remain invested through all market cycles.
- Stagger Lumpsum Capital: If you have a lump sum amount to invest, avoid deploying it all at once when the Buffett Ratio is above historical averages. Use Systematic Transfer Plans (STPs) spread over 6 to 12 months.
- Prioritize Earnings Quality: Stick to well-managed equity funds and businesses with strong earnings visibility rather than chasing speculative market momentum.
Conclusion & Key Takeaways
The Buffett Indicator is an excellent macro tool for assessing overall stock market valuations, but it should be used as a context guide rather than a market-timing device.
Summary Takeaways:
- Definition: The Buffett Indicator measures total listed stock market capitalization relative to nominal GDP.
- Current Posture: India stands at a moderate ~123% (fair value to modestly stretched), whereas the US sits at historic highs above ~219%.
- India’s Growth Engines: Rising retail SIP inflows, economy formalization, and IPO listings support India’s market cap expansion.
- Limitations: Global corporate revenues and interest rate trends mean this indicator must be viewed alongside corporate earnings data.
Successful investing over decades isn’t about trying to time market tops or bottoms—it’s about staying disciplined, maintaining your asset allocation, and letting compounding build your wealth.
What’s Your Investment Strategy Right Now?
Are you rebalancing your asset allocation in the current valuation environment, or are you continuing your monthly SIP discipline without changes? Share your thoughts in the comments section below!
Also Read: Good Loans vs Bad Loans: Some Loans Are Investments, Some Are Financial Traps
Disclaimer: This article is for educational and informational purposes only and should not be considered investment, financial, or tax advice. The Buffett Indicator is a broad market-valuation measure and has limitations, particularly when applied to economies with globally diversified companies, so it should not be used as a standalone market-timing tool. Investors should verify current market data and consider their individual financial goals, risk tolerance, asset allocation, and investment horizon before making investment decisions.